Statistics
Track how you spend your time with visual insights and detailed breakdowns of your events across different time periods.
Screenshots
Statistics by Event Name
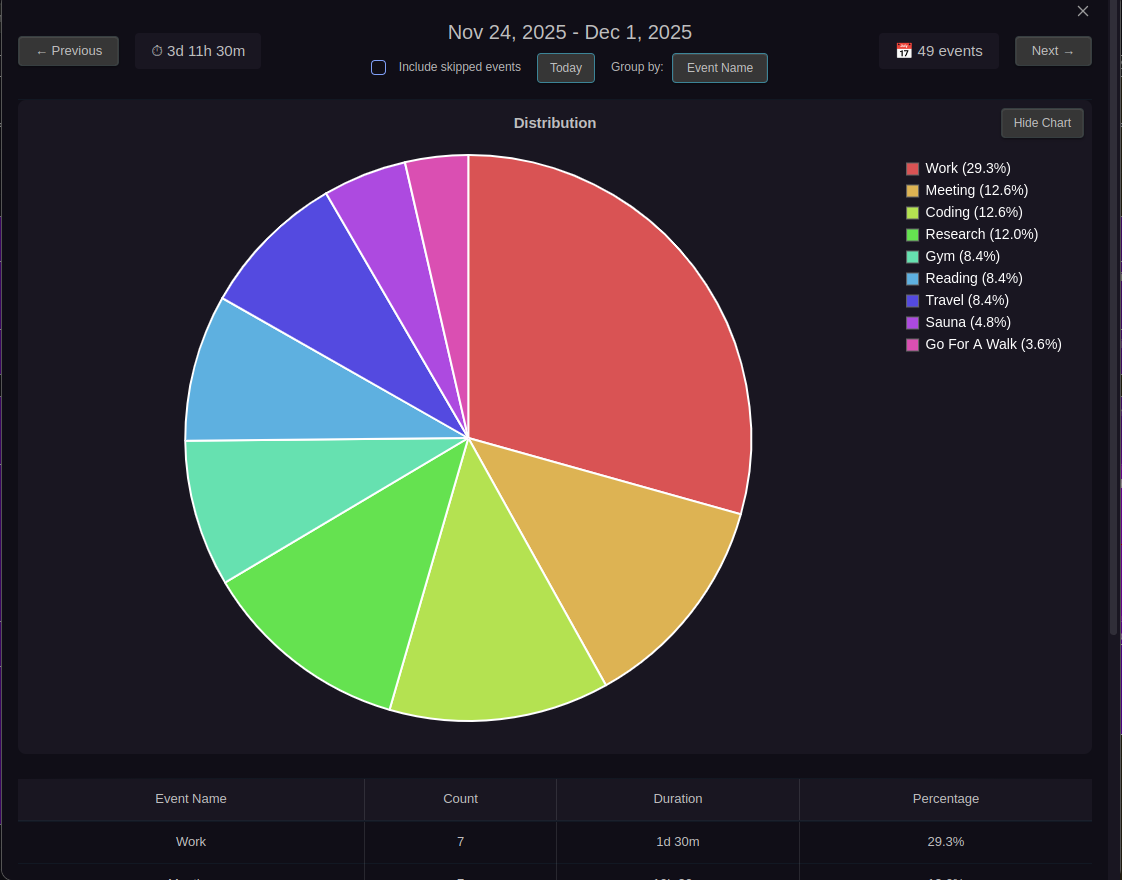
Pie chart and breakdown table showing time distribution grouped by event name
Statistics by Category
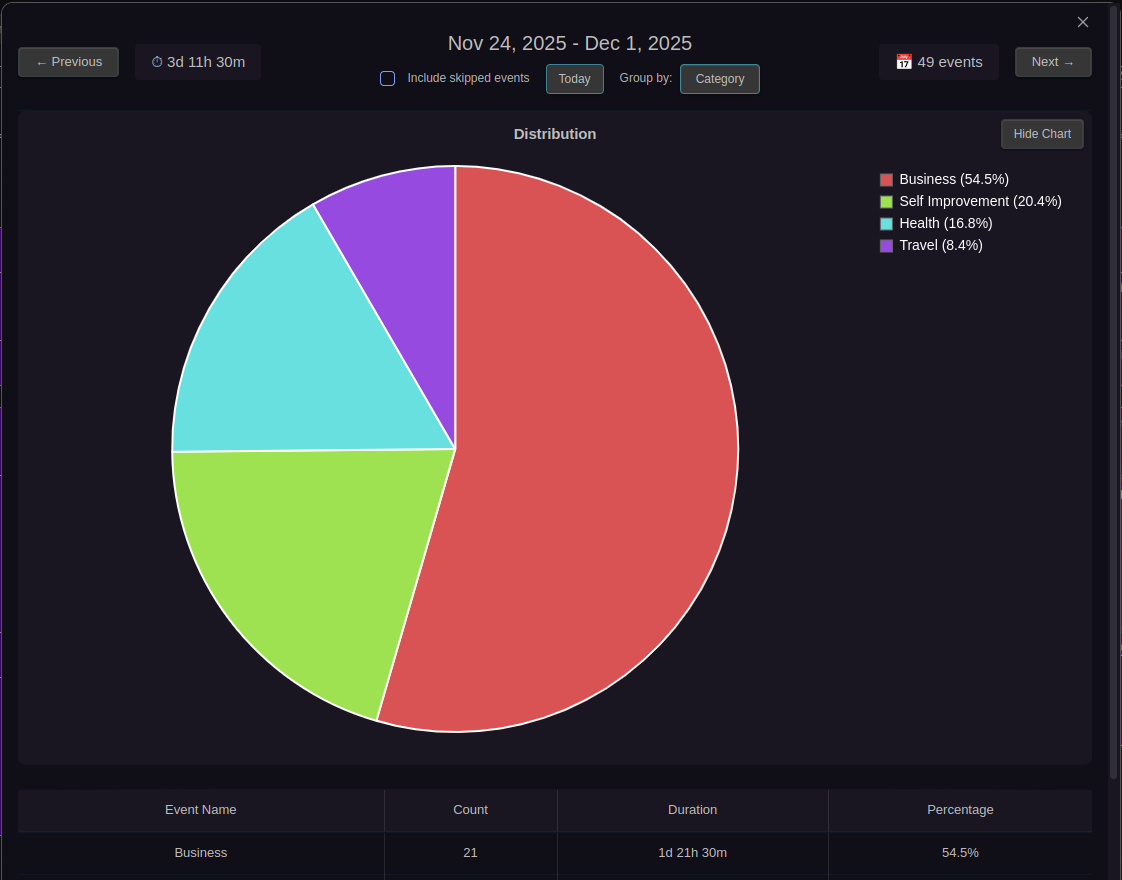
Pie chart showing time distribution grouped by frontmatter category property
Detailed Breakdown Table

Complete breakdown with event count, duration, and percentage for each category
Overview
The Statistics feature provides comprehensive time tracking visualizations that show how your time is distributed across different event categories. Choose from four different views:
- 📊 Daily Statistics: Analyze a single day's time allocation
- 📅 Weekly Statistics: Analyze a specific week (Monday-Sunday)
- 📆 Monthly Statistics: Review an entire month's time allocation
- 🌍 All-Time Statistics: See lifetime totals across all your events
Each view generates a pie chart and detailed statistics table, making it easy to understand your time allocation patterns at different scales.
Key Features
Color-coded pie chart, paginated breakdown table (20 entries/page), period navigation, smart grouping, timed events only
Statistics Types
Daily Statistics
Command: Show daily statistics. Navigate: ← Previous day, Next → day, Today
Weekly Statistics
Command: Show weekly statistics. Navigate: ← Previous week (7 days), Next → week (7 days), Today
Monthly Statistics
Command: Show monthly statistics. Navigate: ← Previous month, Next → month, Today
All-Time Statistics
Command: Show all-time statistics. No navigation, pagination for large datasets
How Event Grouping Works
Aggregation Modes
Event Name Mode (default): Groups by cleaned titles
Category Mode: Groups by frontmatter category. Toggle via mode button.
The default aggregation mode can be configured in Settings → Parsing → "Default statistics grouping".
Recurring Events (Name Mode)
All recurring events grouped together under "Recurring Events" category.
Non-Recurring Events (Name Mode)
Grouped by name after stripping Zettel IDs (14-digit timestamps), ISO dates, and trailing timestamps. Example: Gym 20250203140530 → Gym
Multi-Category Support (Category Mode)
Events with multiple comma-separated categories (Category: Work, Learning) count toward each category separately. Full duration added to each. Total duration shows sum of all category entries (multi-category events counted multiple times). Events without categories grouped under "No Category".
Break Time Property
Add Break property (in minutes) to exclude break time from statistics. Supports decimals. Automatically subtracted when calculating statistics. Original event duration unchanged in calendar view.
Example: 8-hour event with Break: 60 shows as 7 hours in statistics.
Automatic Tracking: Use Time Tracker to automatically calculate break time with ⏸ break / ▶ resume buttons.
What Gets Included
✅ Included: Timed events with start and end times, events within period range, duration minus break time
❌ Excluded: All-day events, events without end time, events outside period range
Understanding the Statistics
Pie Chart: Color-coded slices with proportional sizing and interactive tooltips
Statistics Table: Shows Event Name, Count, Duration, Percentage. Sorted by duration (longest first). Paginated at 20 entries per page.
Period Summary: Period range, total duration, total events, navigation controls (weekly/monthly only)
Use Cases
Daily Time Tracking: Quick daily reviews, productivity audits, day-to-day planning
Weekly Time Tracking: Monitor activity distribution for weekly reviews, sprint retrospectives
Monthly Analysis: Review patterns for monthly reports, billing summaries
Lifetime Patterns: Analyze long-term allocation for annual reviews, career reflection
Work-Life Balance: Track work vs personal vs recurring activities across any time period
Period Comparison: Compare different days, weeks, or months to spot trends
Best Practices
Consistent Naming: Use same base names for similar events to leverage automatic grouping
Always Set End Times: Events without end times excluded (duration = 0)
Category Strategy: Choose grouping approach (by activity type, project, or client)
Regular Review: Make weekly statistics review part of your routine
Related Features
- Time Tracker - Automatic break time calculation
- Global Event Search - Search and filter events
- Filtering - Filter events by properties
- Recurring Events - Set up recurring series
- Event Previews - View detailed information